
Making the Most of Real-time Data
If you’re using your Daktronics video display’s real-time data (RTD) frames, did you know you can easily customize your background and what information is shown on your screen?
6/27/2018
Categories: High School Sports
The universal scoreboard design is timeless, but changing up the theme of your display each year can give your school a modern, cohesive look.
Here are some ideas to design appealing layouts for RTD (Real-time Data) for your display:
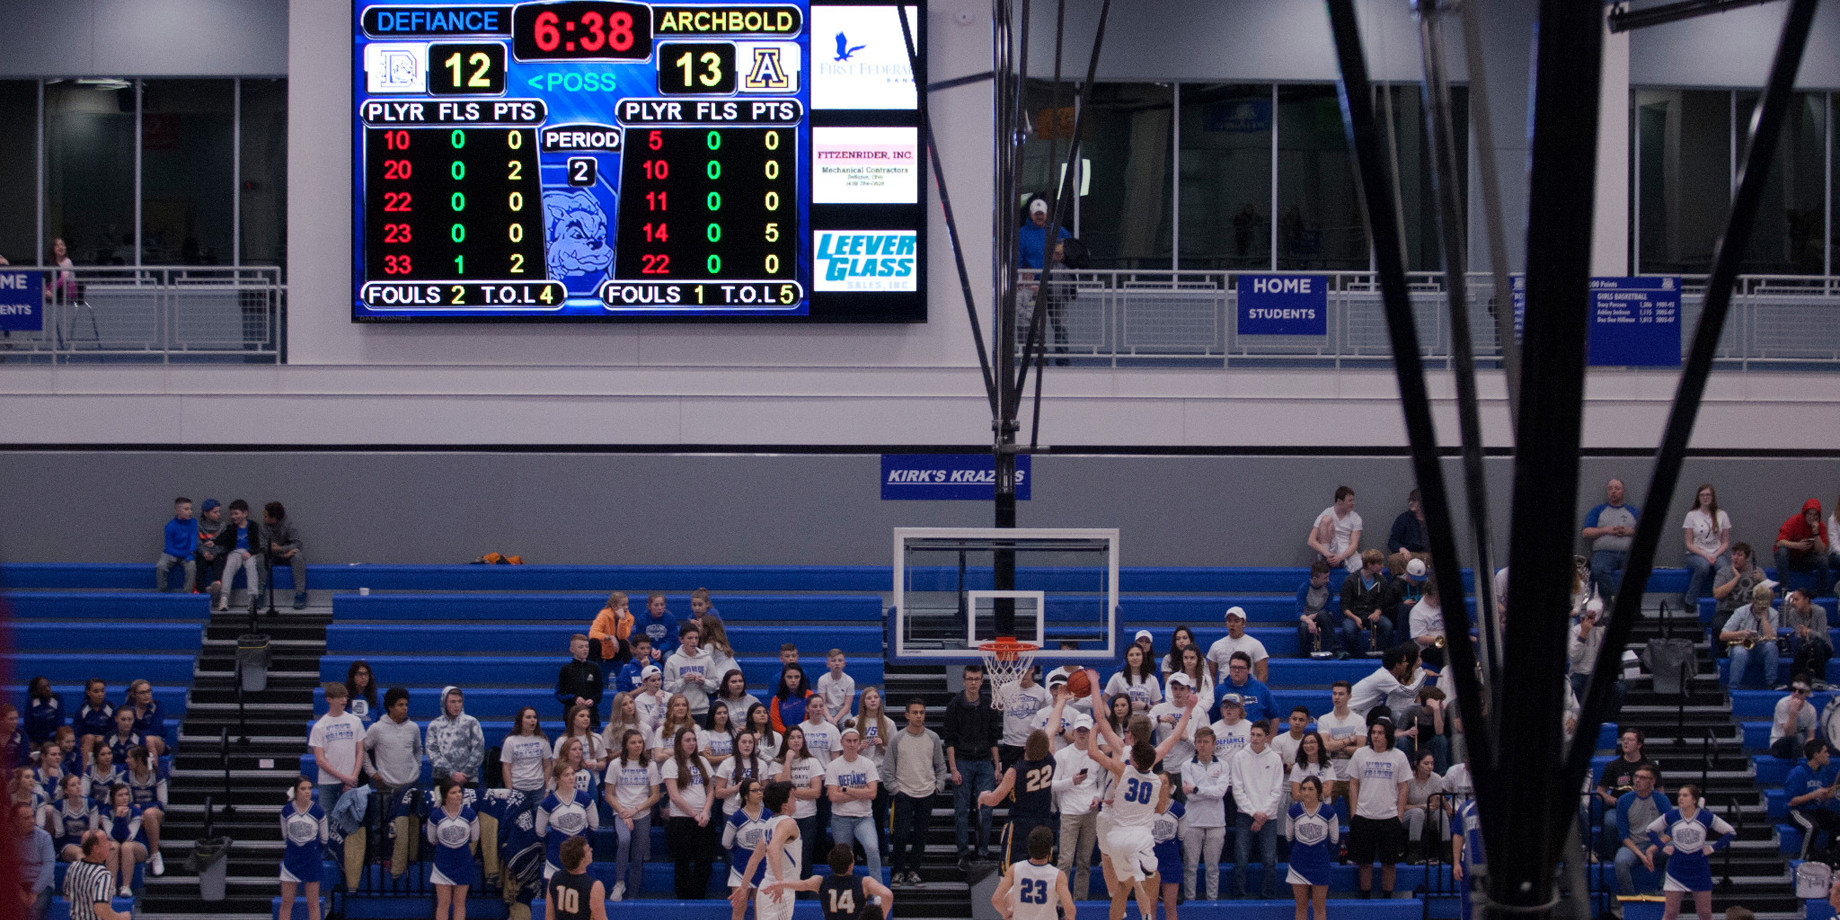
COLOR
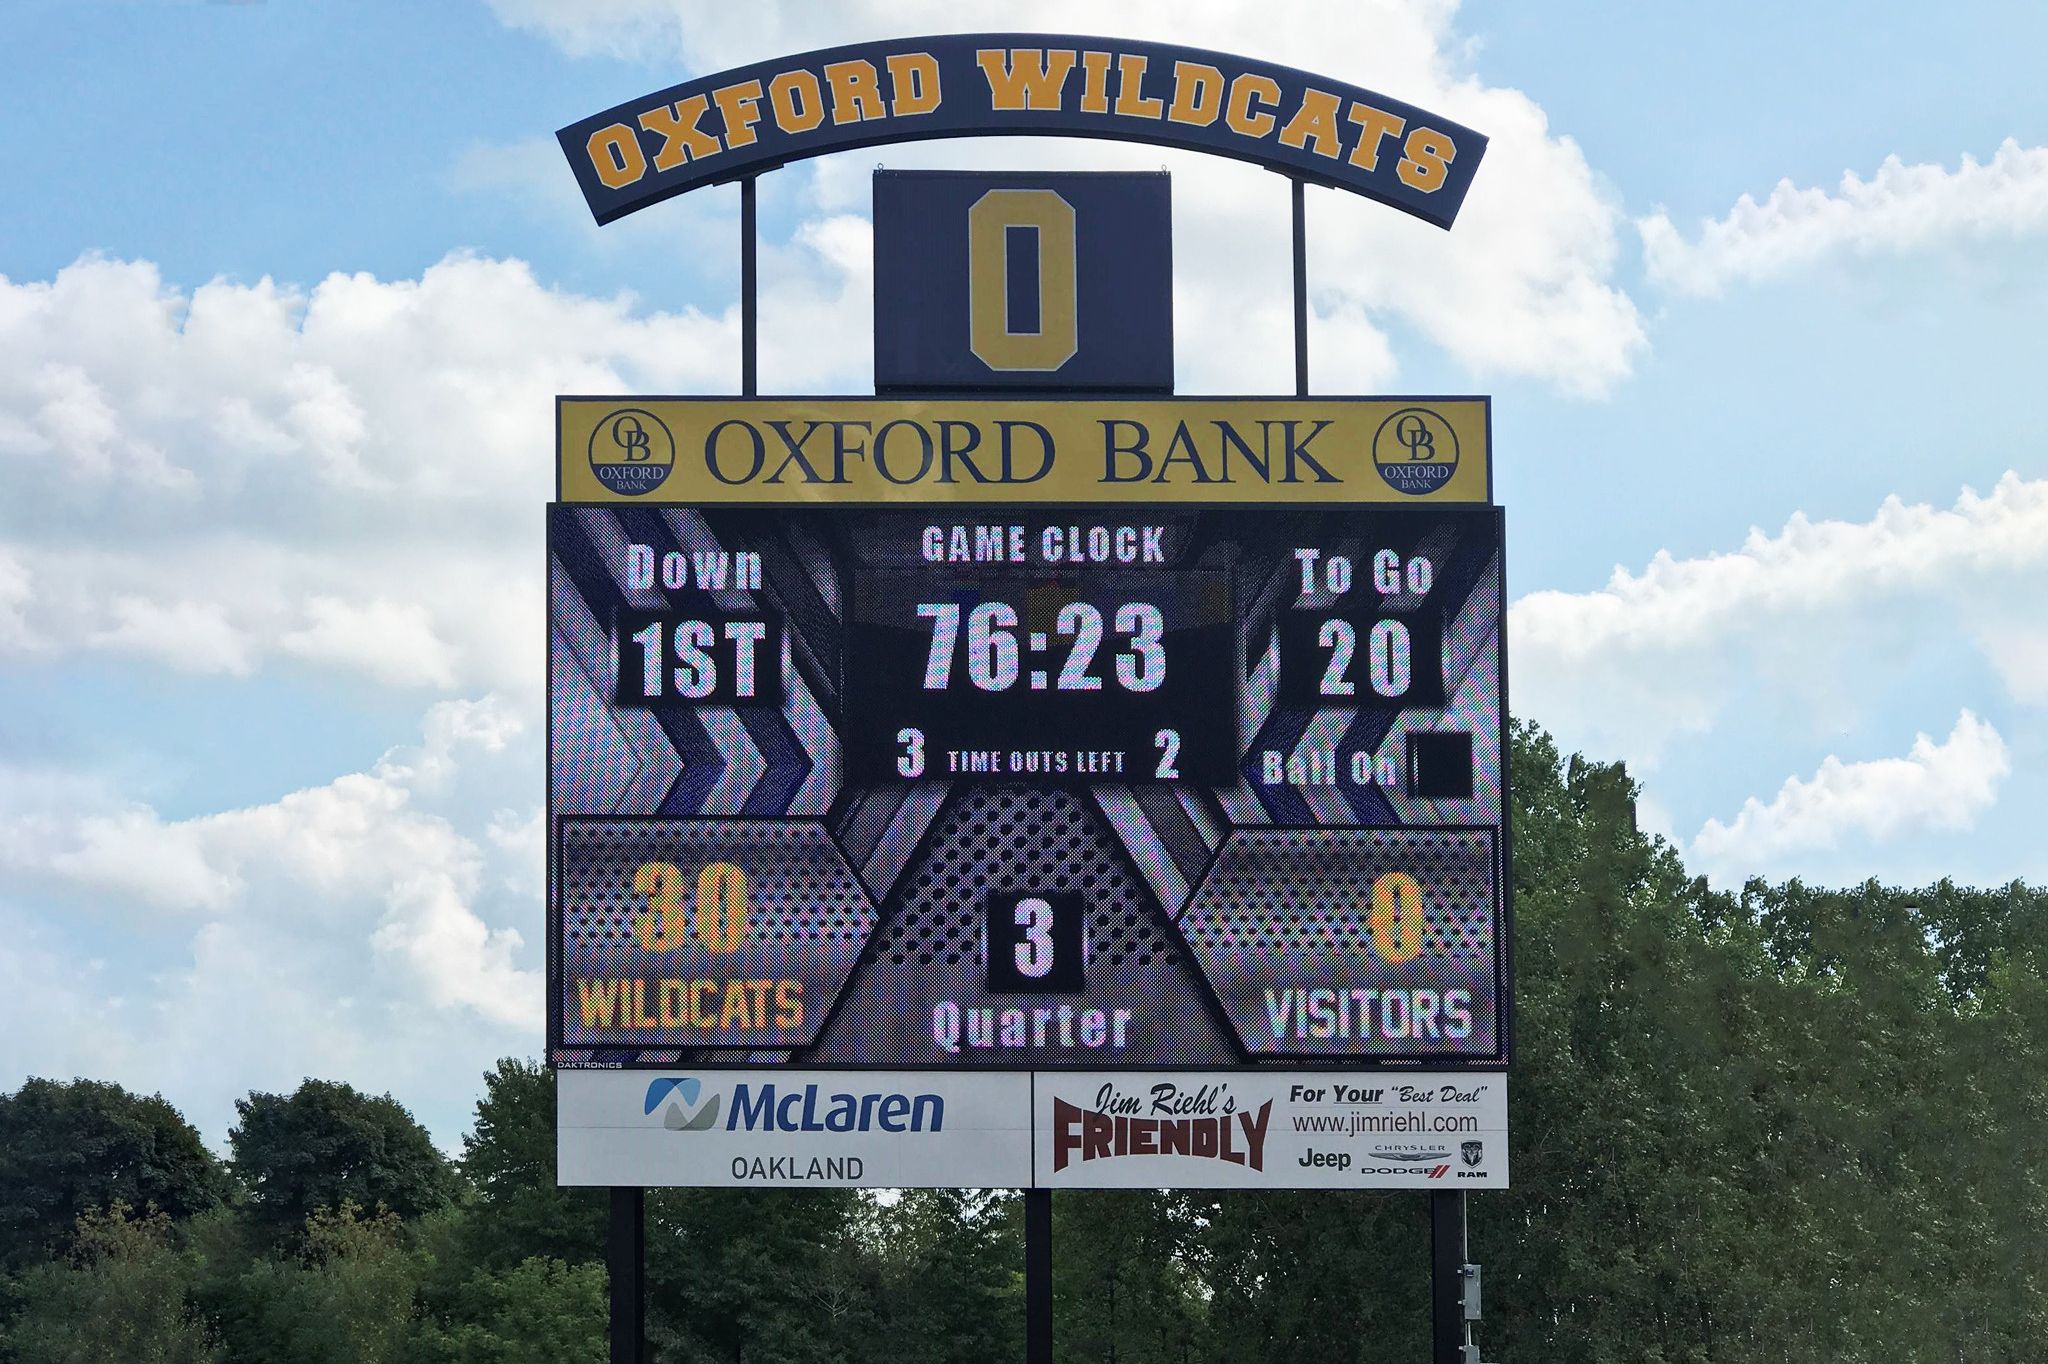
Contrasting colors will help your statistics stand out to the audience. Contrasting colors, like a dark background with light text, will be easy-to-read so the crowd can focus on the game. Using your school’s colors will claim home territory, as well as tie the display into its environment.
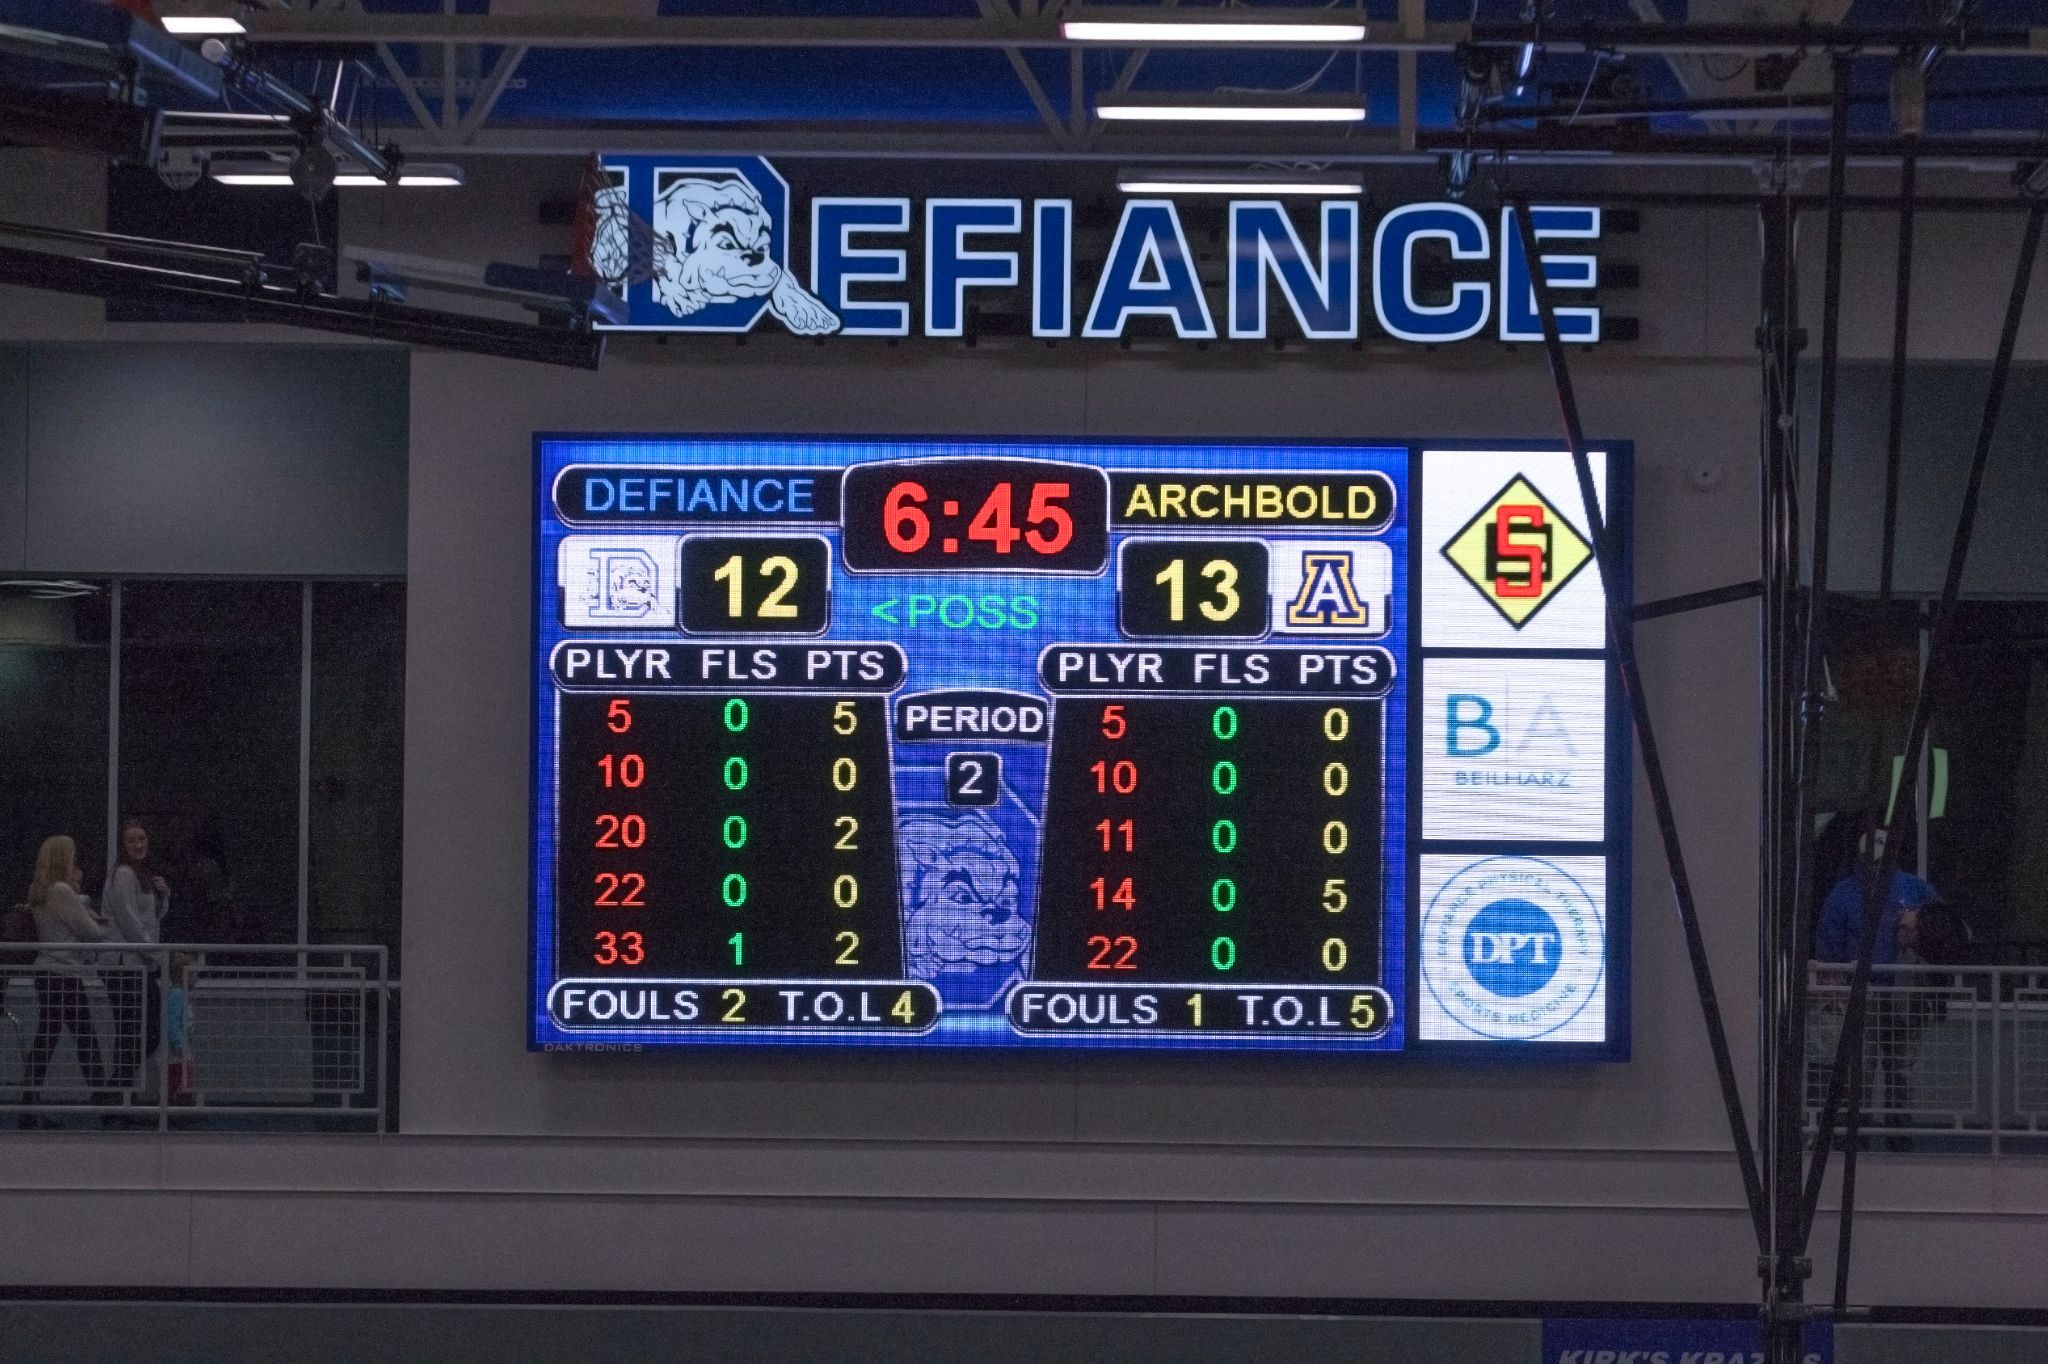 READABILITY
Bold, easy-to-read fonts like Impact work well for displaying statistics. Sometimes adding a division around separate elements can help organize the information shown. Adding a border around elements like sponsored content can set the ads apart from the scores.
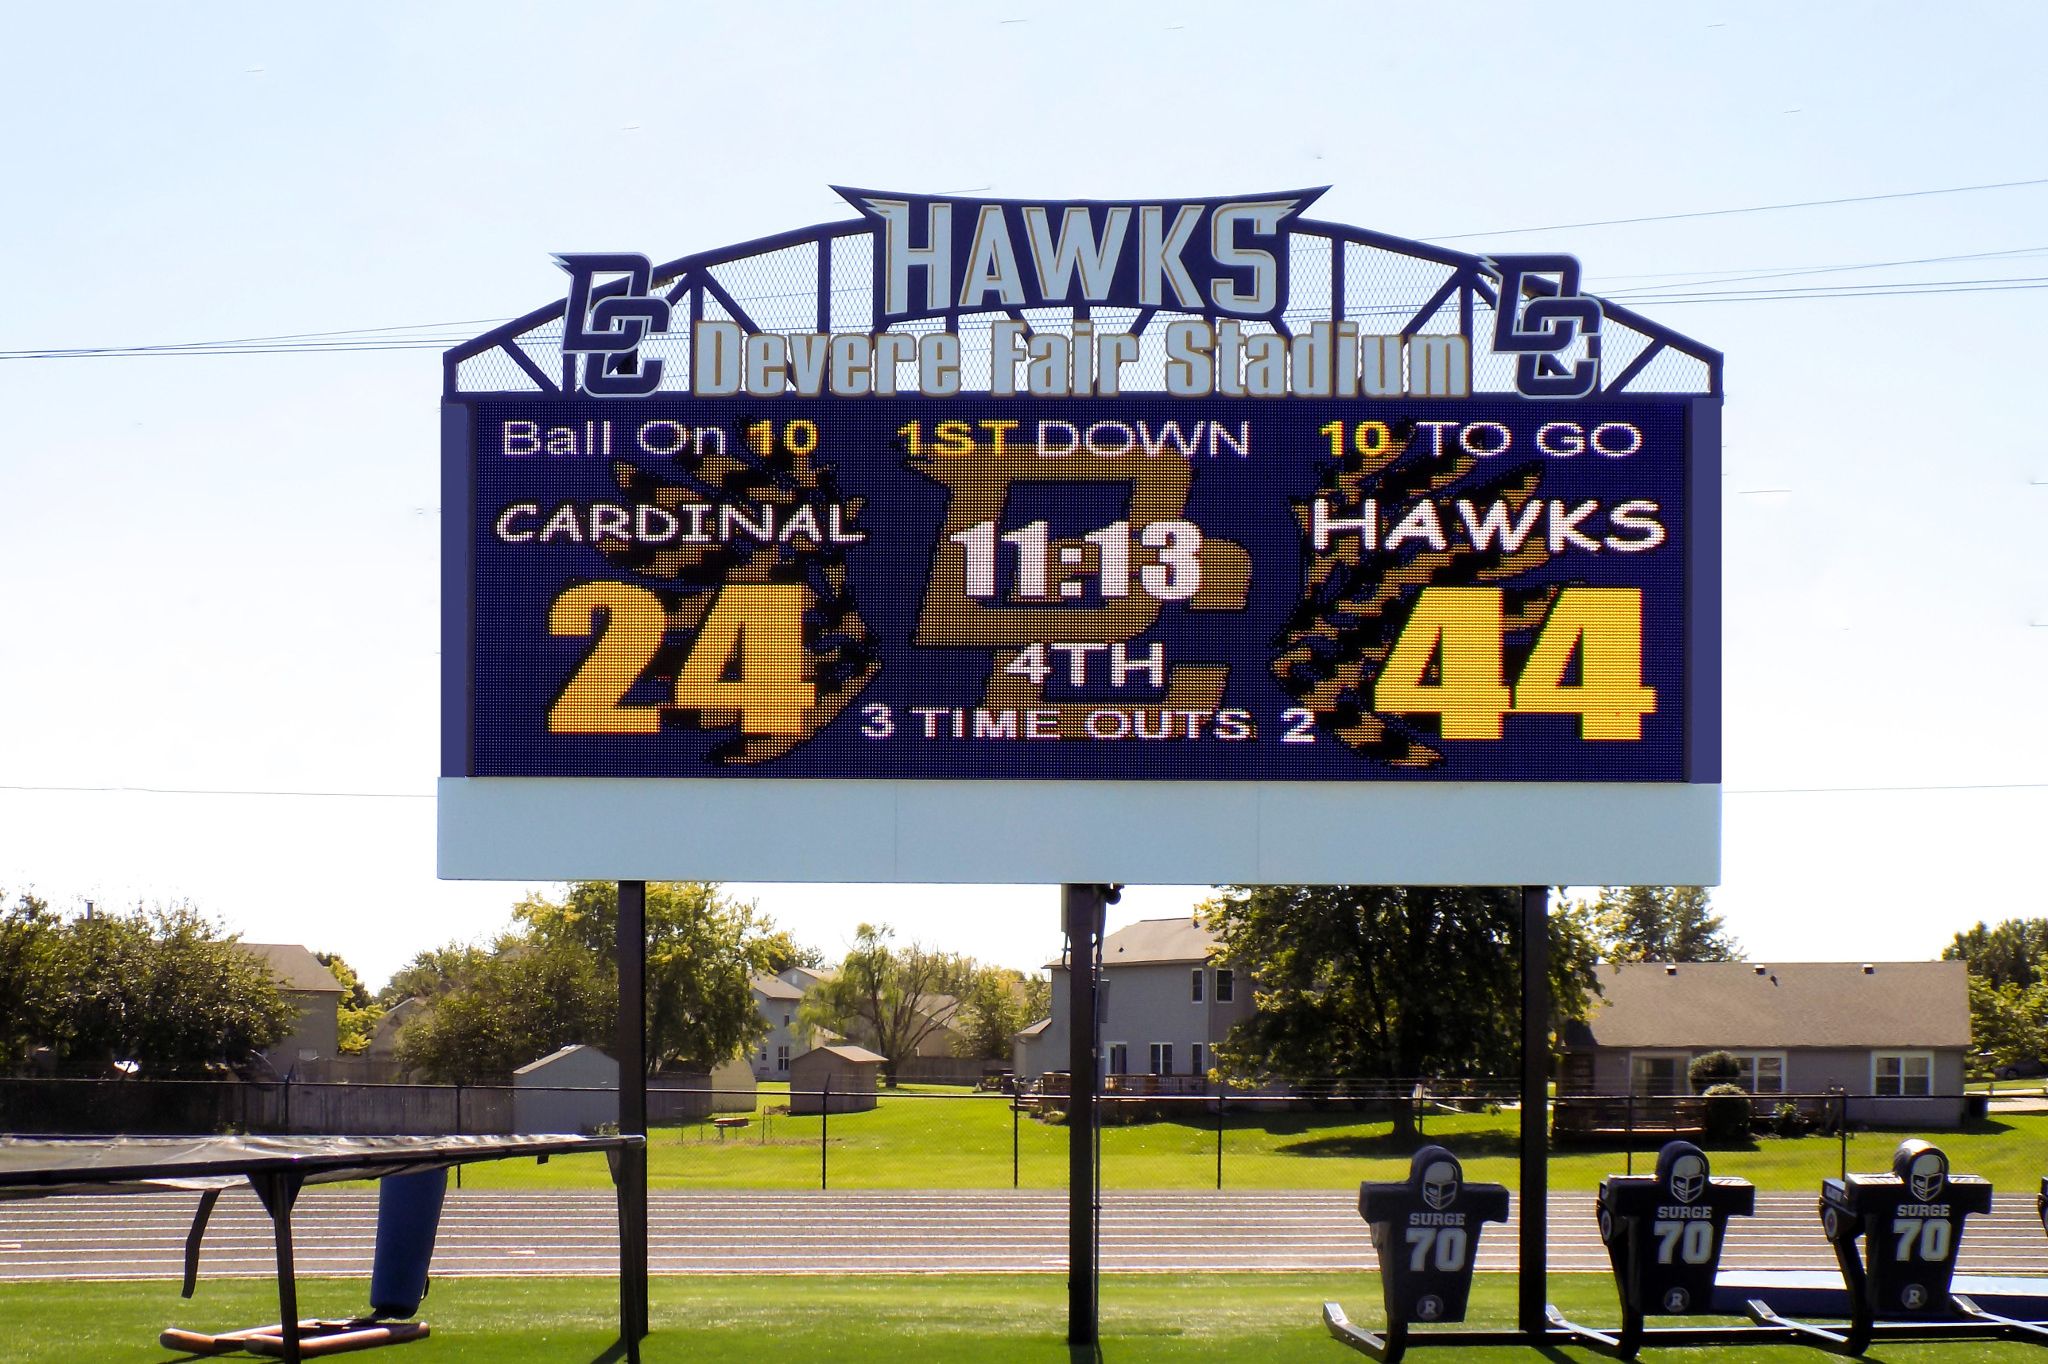
GRAPHICS
Adding visual elements like the logos instead of team names add artwork to your display. Putting a gradient image of your school’s logo or mascot as the background of your display will add a subtle touch of school spirit.
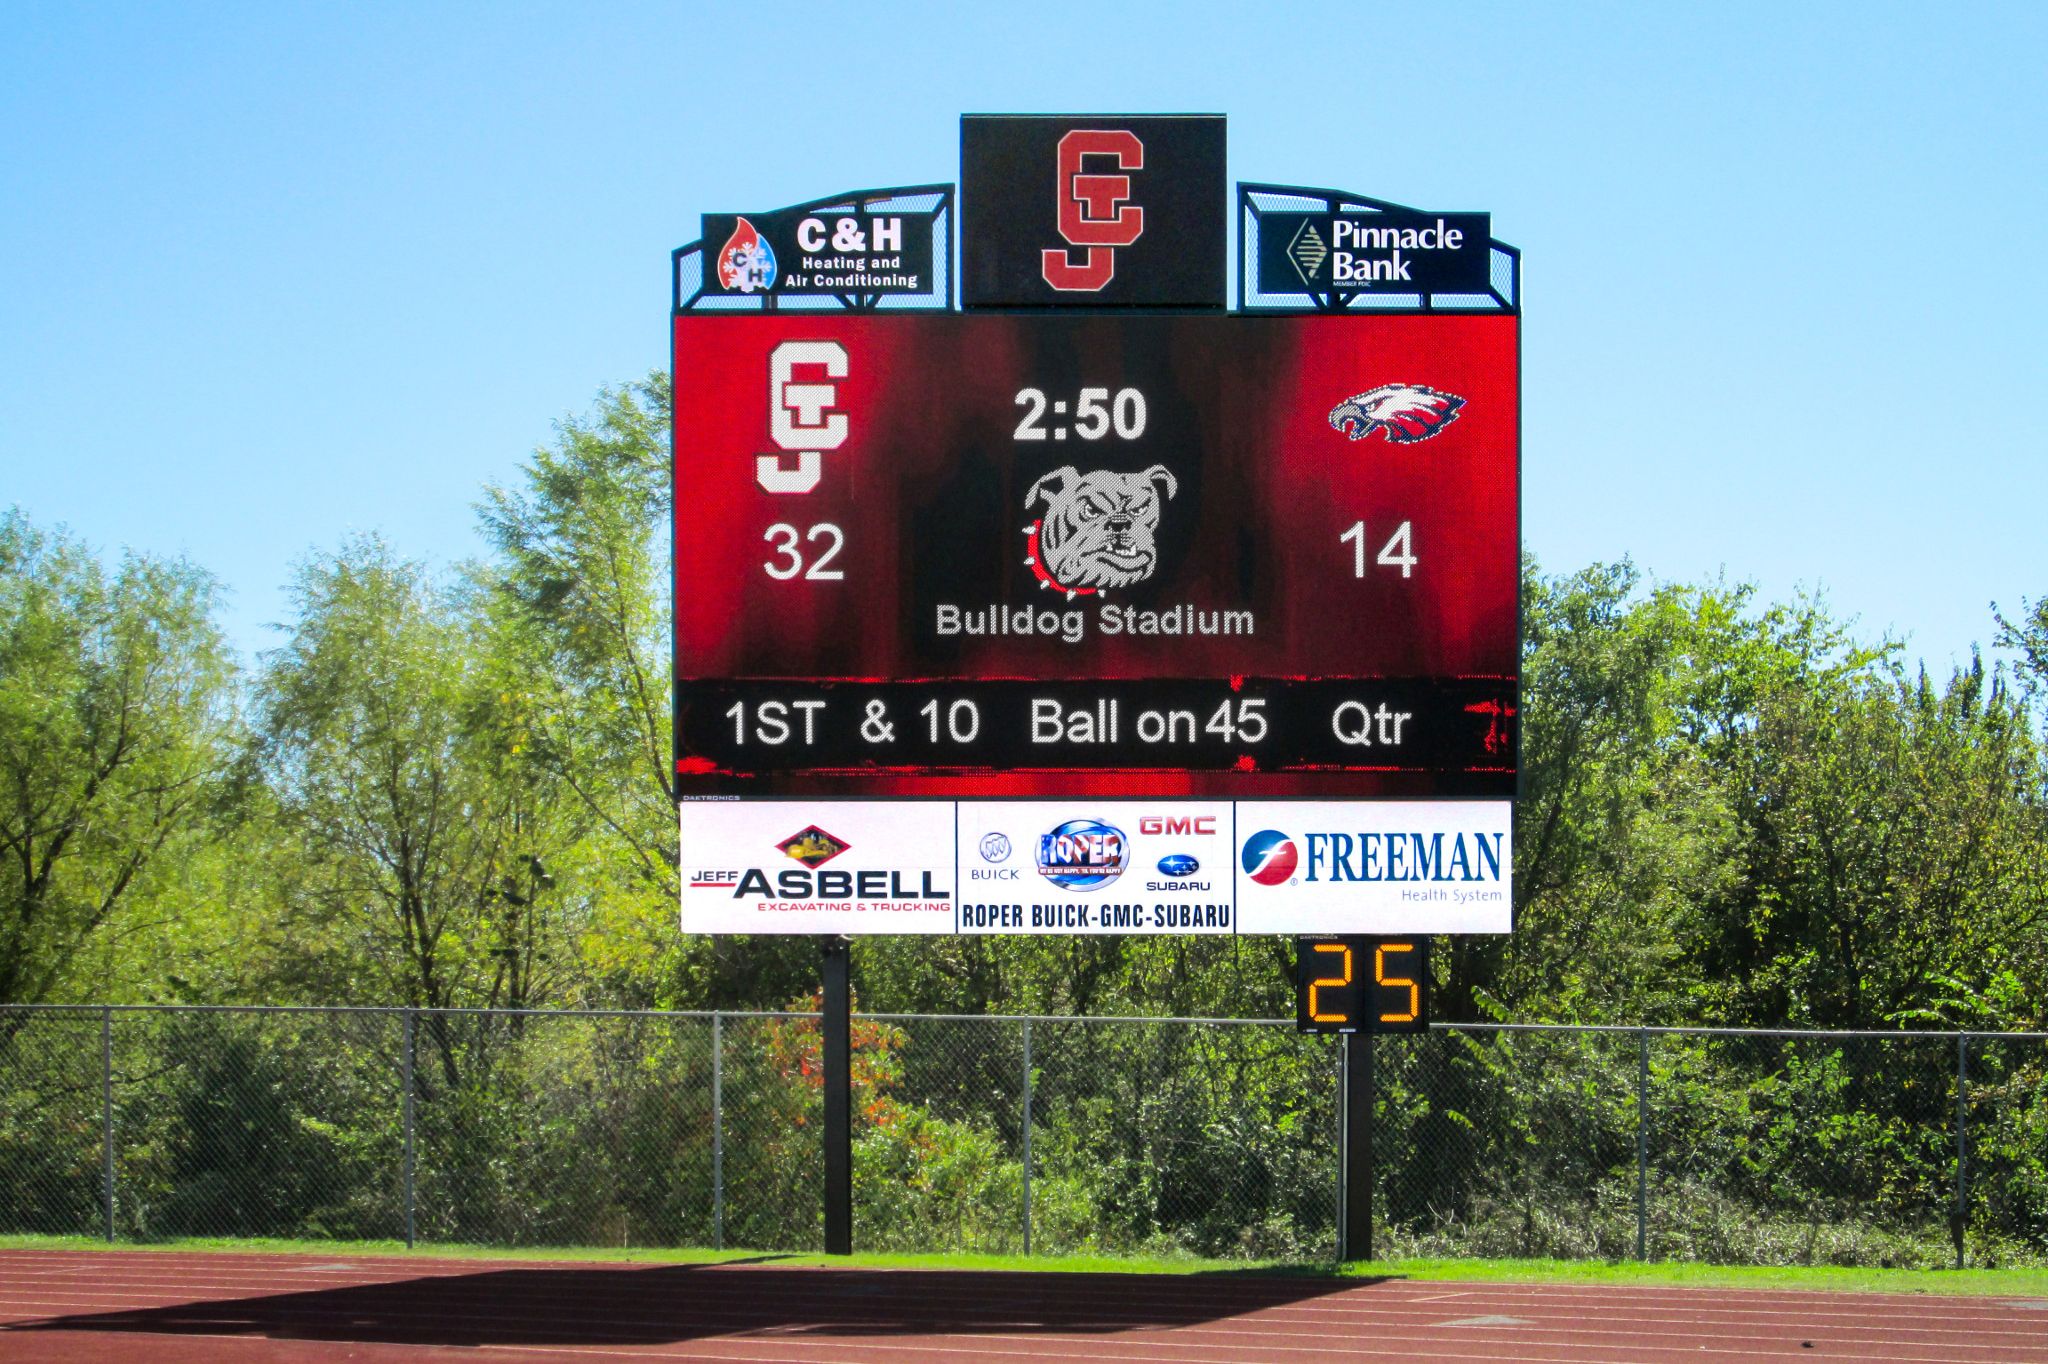
CONSISTENCY AND HIERARCHY
A design that is well-balanced and doesn’t incorporate too many fonts or colors will make your display look more professional. Order the statistics by making the most important numbers and words stand out the most.
Having trouble coming up with a design?
Check out what other schools are doing with their video displays for inspiration.
Don’t want to design content on your own, but still looking for a customized look?
No problem! Daktronics offers team spirit packages you can buy.
All in all, your display should show statistics in an easy-to-read way that engages the audience and gets them excited about the game.